Real Estate Sales & Customer Insights Dashboard
- Yanitha Preedee

- Jul 10, 2025
- 4 min read
Updated: Jul 15, 2025
1. Objective of this Showcase
To demonstrate my ability to transfer subject matter expertise in the real estate business into practical, data-driven visualisation using Tableau. This dashboard project simulates real-world business needs and provides insights tailored for specific stakeholder groups, particularly Sales and Marketing.
What I Did
Designed the entire dataset: created mock data, structured tables, and defined variables that reflect realistic scenarios in the real estate industry.
Dataset and Spatial files Used: Salesdata, Target Profit, LGA Australia Map

Built all calculated fields and LOD expressions, implemented dynamic filters, and designed a user-friendly and engaging dashboard UI.
Created realistic business use-cases to simulate real challenges faced by a property sales company.
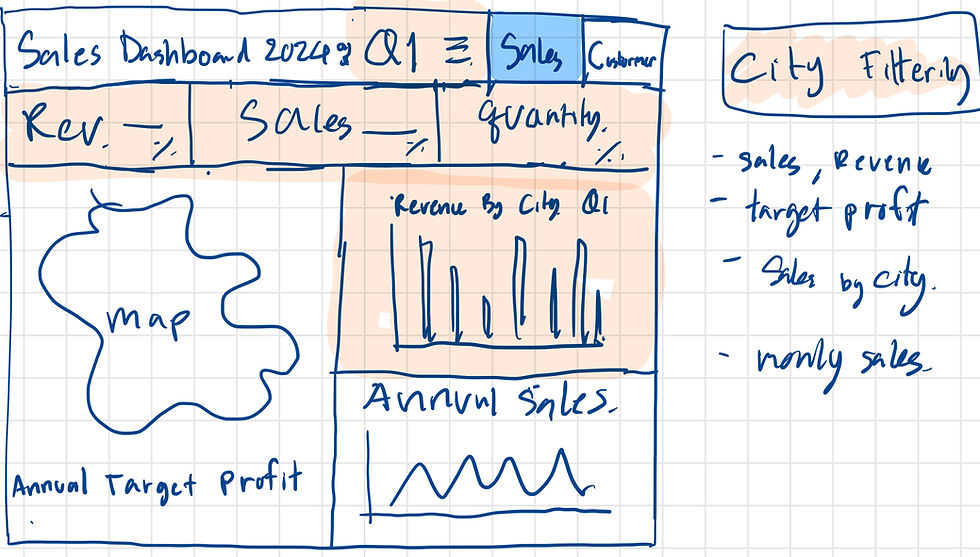
Layout Draft:

Tools Used
Tableau Desktop – for data visualisation and dashboard development
Microsoft Excel & Python – to generate and structure mock datasets
ChatGPT – used as a learning and coding assistant for fine-tuning specific logic (e.g., LOD calculations)
Interactive Dashboard Showcase
Dashboard Access: View on My Tableau Public
Demo Video: Interactive Walkthrough
Project Scenario
YNTH Proptech is a property technology company offering multi-channel sales services across 8 cities in NSW
via 4 platforms (Website, Mobile App, Agent Portal, Partner Referral Network)
It sells 4 property types (Apartment, Land, Townhouse, House) to 4 customer segments
(First Home Buyers, Investors, Downsizers, Upsizers)
The company’s revenue is generated from incentives for each successful sale. Each sales team is assigned an annual profit target per city.

Business Requirements
The Sales & Marketing team needs a comprehensive dashboard to:
Understand 2024 performance trends by city and customer segment
Identify top-performing property types per segment and city to align 2025 strategy
Analyse leading sales channels by product and city for more accurate marketing budget allocation
Track quarterly performance vs. targets to drive future campaign decisions
My Deliverables:
Sales Dashboard: Includes revenue, sales value, unit sold, and actual profit vs. target
Customer & Product Dashboard: Highlights top products by segment and their sales channels
Quarter and City Filter: Dynamic parameters for custom views
KPI Cards: Instant metrics with up/down indicators
Map Visualisation: Geospatial analysis of actual profit vs. annual targets
Sales Trend Chart: Line chart showing monthly property revenue trends throughout the year.
Interactive Dashboard Showcase
Dashboard Access: View on My Tableau Public
Dashboard Summary
Overview: The YNTH 2024 dashboards provide an interactive, quarterly view of property performance across NSW cities. They allow users to slice data by quarter and city, offering visibility into sales trends, channel performance, and customer preferences.
📌 Key Features:
Filter by City & Quarter
Profit Map with % of target achieved
Top Product per Customer Segment
Sales Channel Breakdown by Property Type
Annual Sales Trend (Line Chart)
📌 Dashboard Insights Summary
1. Overview
1.1 Sales Performance
In 2024, four cities achieved profit levels above their annual targets.Inner West stood out with a +1.25% profit margin above target, and it also had the highest number of properties sold across all quarters.
------------------------------------------------------------------------------------------
Recommendation: Consider increasing sales focus in Hornsby, Penrith, and Randwick, as these cities also exceeded their profit targets — indicating strong market demand and growth potential.
1.2 Product & Customer Segments
Townhouses were the most purchased by First Home Buyers, while
Apartments were the top choice for Upsizers, contributing to over $417M in total sales.
Investors and Downsizers preferred Houses, generating more than $300M in combined value
------------------------------------------------------------------------------------------
Recommendation: Refine product messaging to align with each customer segment’s preference. Highlight affordability and accessibility in Townhouse campaigns for First Home Buyers.
1.3 Sales Channel Performance
Sales channels were fairly balanced overall, with the Website contributing the highest proportion at 28% of total successful sales.
------------------------------------------------------------------------------------------
Recommendation: Since the top-selling product (Townhouses) for First Home Buyers performed best via the Website, it's recommended to:
Launch targeted digital campaigns focused on First Home Buyer needs.
Use internal customer data to explore demographics and behaviour in this segment.
Align marketing budget based on city-level performance and sales trends.
2. Seasonality Sales Trends
Sales dipped in Q1 but rose sharply in Q4, indicating stronger customer spending toward the end of the year.
Peak sales months are:
October (highest value) and December – possibly due to year-end urgency.
January and March also perform strongly.
February sees the lowest sales — useful for adjusting campaign timing and budget during that dip.
------------------------------------------------------------------------------------------
Recommendation: Maximise momentum during low-sales quarters by focusing on high-performing cities:
Q2 - Penrith, Parramatta, and Blacktown
Q3 - Hornsby
Deploy well-timed product-channel strategies to capture seasonal opportunities, especially for high-demand segments.
3. Most Effective Sales Channels by product type
Summarise by product type, and top channel.

Strategic Recommendation:
Instead of equal ad spend, adopt a channel-product pairing strategy:
Website → Apartments
Referral + Application → Townhouses
Agent Portal → Lands
Application → Houses
Summary
This showcase reflects my ability to bridge domain expertise in real estate with data-driven problem solving. From designing realistic datasets and building complex Tableau dashboards to uncovering strategic business insights, this project demonstrates a full-cycle analytical workflow tailored to stakeholder needs.
By simulating real-world marketing and sales challenges, I was able to deliver actionable insights such as top-performing products per customer segment, channel effectiveness by property type, and seasonal performance trends across NSW cities. Each visual and calculation was purposefully designed to support smarter planning and targeted decision-making.
Through this project, I not only reinforced my technical capabilities in Tableau, Excel, and Python, but also showcased my ability to translate data into business value — a critical skill in any modern analytics role.
Key Skills Demonstrated
Business Analysis & Data Storytelling
Tableau (Parameters, Filters, LOD Expressions, KPI Visualisation)
Stakeholder Alignment (Marketing & Sales needs)
Dashboard UI/UX Design
Data Modelling & Mock Data Generation (Excel, Python)
Insight Delivery for Strategic Decision Making


Comments